HYPOS on stage
Awards, articles, webinars – The HYdro-POwer-Suite (HYPOS) has been launched successfully. Here is a short update on all the news.
The new portal advances the management of water resources and – in particular – sediment management. It transforms satellite-based water quality and sediment related parameters into business relevant tools for the hydropower industry, enabling effective environmental and economic investment planning. The online tool for the hydropower industry combines Earth Observation (EO) technologies with hydrologic modelling, and can be complemented by local on-site information.
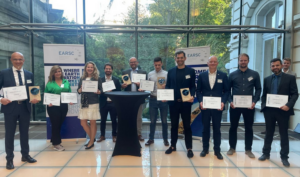
Ilias Pechlivanidis (SMHI; 4th from the right) accepts the EARSC award on behalf of the HYPOS consortium in Brussels.
In June 2022, the HYPOS consortium was among the winners of the EARSC 2022 Partnership Award, recognizing outstanding collaboration for Earth observation user-uptake and value creation from innovation to market!
In April 2022 followed the successful launch of the HYPOS Portal during the HYDRO 2022 Conference and Exhibition in Strasbourg, France. The annual HYDRO Conference and Exhibition series brings industry professionals together and is one of the key business shows for hydropower in Europe.
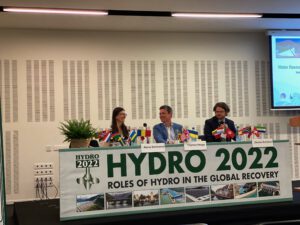
Panellists at the HYDRO 22 Alena Bartosova (SMHI), Thomas Heege (EOMAP) and Declan Kelleher (Gruner Stucky)
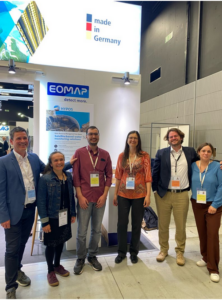
The consortium members at the HYPOS booth.
New features for HYPOS
The HYPOS tool is an easy-to-use, web-based subscription portal. It provides streamlined and cost-efficient access to key hydrological parameters and sediment data for rivers and reservoirs worldwide. Available products include:
- Satellite-based measurements for historic time periods and actual continuous monitoring;
- Up-to-date hydrological information from global and tailored modelling;
- Integrated tools for conducting baseline and environmental impact assessments
The HYPOS portal is now online, available under hypos.eoportal.de. User will get a holistic view on the catchment, the river systems and the reservoir of their interest. The main features of the portal are the visualisation of data from different sources (satellite, in-situ and model data), their integration, and tools to analyse them. The analysis feature contains tools to extract sediment fluxes at any given point in the river system, as well as a tool to calculate the Blue Water Footprint (BWF; “lost water” of a reservoir: evaporated water per power production).
Read more about the new features and use cases below.
Feature "Visualisation"
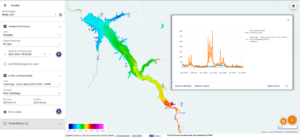
Figure 1: Visualize your data with map views and time series plots
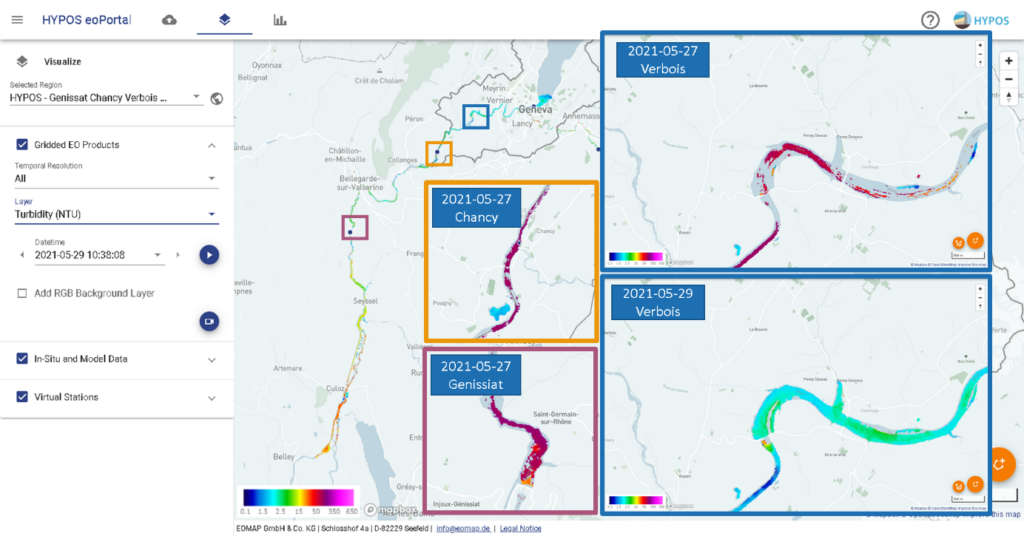
Get a first glance at the data – from your own in-situ data to hydrological parameters from models to spatial grid data from the satellites (Figure 1). Aggregate the satellite data for polygons defined by you to get deeper insights. Plot time series of all data together to better understand your catchment. Transect plots for different dates reveal the changes within a reservoir or along a river.
Feature "Alert Dashboard"
The HYPOS portal can notify you if certain thresholds are exceeded. Once you define thresholds for each parameter (e.g. turbidity), the system displays the exceedances in a dashboard with all your virtual stations (polygons defined by the user). This allows you to see which parts of the catchment are currently above the limits and how often they have been in the past. By selecting one station/polygon, you will be able to analyse the data even deeper with time series plots and two synchronized maps. The system will also automatically notify you via e-mail when thresholds are exceeded in near-real-time (NRT, usually within less than 24 h).
Feature "Sediment Calculations"
The data provided in the portal allows you to calculate sediment fluxes at any point in the river. Sediment fluxes are the product of discharge and sediment concentrations (SSC). The discharge can either come from in-situ measurements, if available, or from the global or locally customized hydrological models developed using Hydrological Predictions for the Environment (HYPE) in daily resolution. The sediment concentrations can be provided by the satellite measurements of turbidity (TUR) with a transfer function. This transfer from TUR to SSC can be done with a global formula or with a localised function if field measurements of SSC are available for calibration.
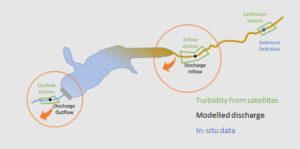
Figure 2: Schematic setup of sediment flux calculation within the HYPOS tool.
Since the SSC from satellites is usually not available every single day, the SSC can also be estimated from the continuous discharge measurements with a power regression. HYPE model provides daily estimates of SSC as well as sediment fluxes at selected points. With this approach it is possible to retrieve sediment fluxes for long time periods. A typical setting with some (short term) SSC data measured with an in-situ station is sketched in Figure 2. The first step is to calibrate the satellite derived turbidity values with in-situ SSC values to retrieve a correlation that can later be applied anywhere in the river (upstream section on the right). The combination of SSC from satellites and discharge from the model can be used to retrieve sediment fluxes at the inflow and the outflow of the reservoir (orange arrows). This finally allows to estimate the sediments that are held back in the reservoir.
Feature "Blue Water Footprint (BWF)"
The Blue Water Footprint (BWF) is an indicator that builds on the ratio between evaporated water from the reservoir and the power production in the HPP. It is thus a measure of the water “lost” by the reservoir. The BWF is influenced by the climatic conditions and the reservoir surface area of the respective site (evaporation) and the power generated in the power plant. The evaporation can be calculated from satellites to build a monthly mean evaporation value. This is then divided by the monthly power production to retrieve a monthly BWF. The water lost due to evaporation impacts the productivity of the power plant, as well as downstream water availability for other purposes (irrigation, drinking water, ecological impacts).
Two Use Cases
Use case 1: Banja, Albania - sediment flux calculation and BWF
The sediment flux approach described above was applied in the Devoll river and compared to a sediment flux calculated from both in-situ discharge and SSC. The results showed an overestimation of 23 % by the HYPOS approach over a 3-year period. While the HYPOS approach delivers data for every day of the year, the in-situ station only provided data for 62 % of the days. The costs for the HYPOS solution were around 10 % of the costs for the in-situ stations’ setup and maintenance.
These are the key results from the Banja use case:
Use case 2: Rhône – Monitoring of flushing operations
The Rhône flows out of Lake Geneva and runs through a cascade of hydropower plants in both Switzerland and France. Flushing operations are challenging and need proper planning to ensure a propagation of the sediment flow through all dams. Additionally, strict thresholds for SSC need to be maintained to avoid environmental impacts like fish kills. The satellites enable a total surveillance of the river during flushing operations, including all side arms and ponds (see Figure 3). Along the Rhône, the propagation of sediment-laden waters can be observed in near-real-time.
The key result from the Rhône use case:
HYPOS within the SMHI water service line
Water modelling services that include water quality in the production chain are almost non-existent, making the HYPOS Portal a cutting-edge solution for reservoir managers. The core service for a modern production of water information can be displayed as a production chain, and divided into several nested loops containing the major components necessary for the production.
The process is driven by user dialogues, which inform and guide model development through to their operational production. Underlying the water services are data coming from various sources, such as hydro-meteorological and landscape feature data, their confidentiality (open data), and their temporal availability (e.g. near-real time, historical).
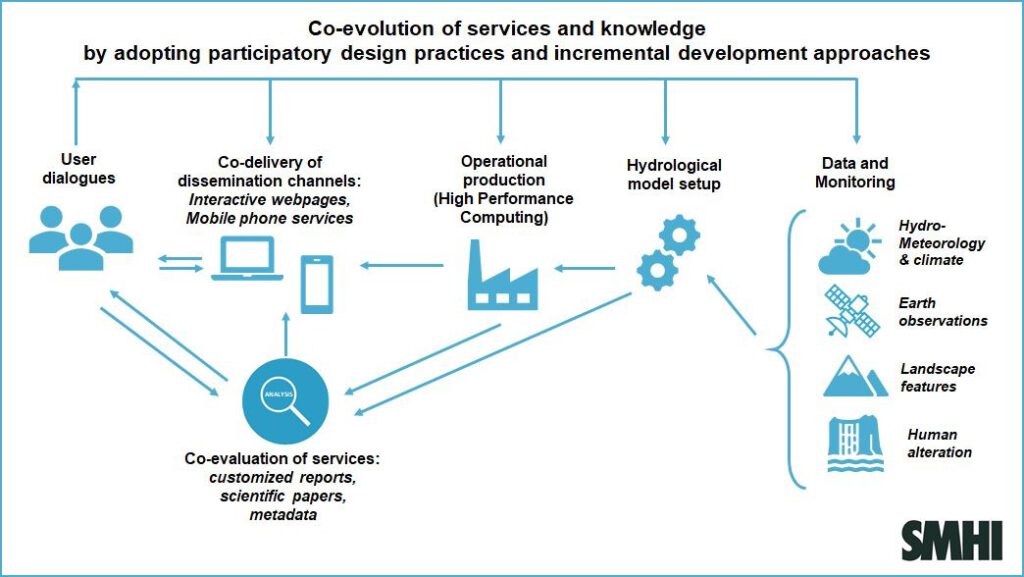
Figure 4: Workflow for water-information production in a core service.
Within HYPOS, Earth observation (EO) data are being adopted into the HYPE hydrological modelling chain to improve monitoring and predictions. EO products provide not only spatiotemporal information on water quality but also on important hydrological processes (e.g. evapotranspiration or snow cover). These products are valuable within modelling for supporting a priori parameter estimation, dynamic forcing, model setup/development, model evaluation and data assimilation.
Using the global-scale World Wide HYPE (WWH) model, local-scale hydrological models have been customised for each of the four case studies, prioritising user needs by: (i) incorporating important local hydrological features not present in the global model (e.g. smaller reservoirs or tributaries), (ii) refining catchment boundaries so users can access information at all important locations, and (iii) including local hydrological processes that affect the water cycle (e.g., karstic areas; water transfers). For tailoring the existing WWH setups for case studies, a workflow has been developed (Figure 5). The iterative steps in the workflow have been further condensed into a set of Key Performance Indicators, allowing customers to monitor the modelling process.
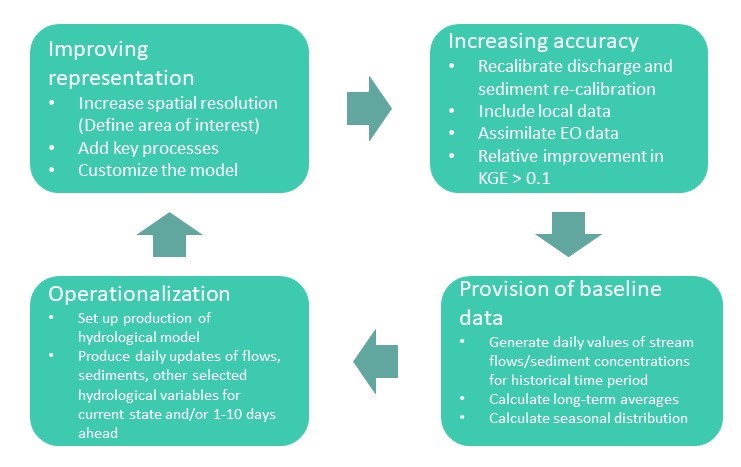
Figure 5: General approach to customizing WWH to local requirements in HYPOS.
HYPOS Outreach
HYPOS Webinars
HYPOS partners shared the science behind the portal in two webinars leading up to the Technical Launch in April. Links to the videos can be found below:
- Hydropower Management from Space – hypos-project.eu
- How Satellite Data Can Boost Water Quality – hypos-project.eu
In the media
You are welcome to learn more details in one of these articles:
- Satellites can tell you (almost) everything about your reservoir. (hydropower.org)
- Remote Sensing | Free Full-Text | A Satellite-Based Tool for Mapping Evaporation in Inland Water Bodies: Formulation, Application, and Operational Aspects (mdpi.com)
- Satellite sediment management – International Water Power (waterpowermagazine.com)
Conferences and Papers
The following conference contributions have been triggered and co-funded by HYPOS:
- The XIth Scientific Assembly of the International Association of Hydrological Sciences (IAHS) 2022 (29 May-3 June): Assessing robustness of large-scale hydrological and sediment modeling using nested domains under current and changing climate by Alena Bartosova et .
- ASITA (Federation of Scientific Associations for Territorial and Environmental Information) Conference 2022 (Genova, 20-24th June): Integration of EO derived data in a decision support tool for hydropower managers by Erica Matta et al.
- Online HYPE Conference 2021: (27 May): Reservoir sedimentation in HYPE by Conrad Brendal et al.
- ESA Living Planet Symposium (23-27 May 2022): Application of an EO-based model for the study of evaporation from water bodies by Erica Matta et al.
- HYDRO 2022 (25-27 April): Advancing large scale hydrological and sediment modeling for hydropower industry operations by Alena Bartosova et al.
- The 24th International Congress on Modelling and Simulation (MODSIM) 2021 (5-9 December): Assessing uncertainty in large-scale hydrological and sediment modelling using nested domains under current and changing climate by Alena Bartosova et al.
- The 24th International Congress on Modelling and Simulation (MODSIM) 2021 (5-9 December): Relative importance of hydrology optimization targets and sediment routine combinations towards calibration of a global sediment model by Conrad Brendel et al.
- AIOL (Associazione Italiana di Oceanologia e Limnologia) Congress 2021 (30 June-2 July): Role of spatial variability, data availability and operative application in the production of lake evaporation maps. A combined remote sensing and numerical modelling study by Erica Matta et al.
Try HYPOS for your project
For any further questions, please get in touch via Email: contact(at)hypos-project.eu